

(Kitco NewsWire) - Spot gold and silver prices are lower in late-afternoon U.S. trading Tuesday, as rising crude oil prices, elevated Treasury yields and firmer Fed-hike expectations outweighed the safe-haven bid from renewed U.S.-Iran tensions. At the time of writing, spot gold was trading near $4,368.60 an ounce, down 0.83%, while spot silver was trading at $65.830, down 0.32% on the session.
North American equity markets closed lower as higher oil prices revived inflation concerns. The S&P 500 fell 45.08 points, or 0.6%, to 7,673.52, the Dow Jones Industrial Average dropped 628.18 points, or 1.2%, to 52,786.07, the Nasdaq Composite lost 85.58 points, or 0.3%, to 26,421.41, and the Russell 2000 fell 15.44 points, or 0.5%, to 2,960.20. European markets finished narrowly mixed, with the STOXX Europe 600 down 0.05% to 649.60. London’s FTSE 100 fell 0.10% to 10,811.66, Germany’s DAX was flat at 26,007.63, France’s CAC 40 rose 0.14% to 8,317.98 and Italy’s FTSE MIB slipped 0.10% to 52,177.47.
The latest positioning remains centered on this week’s inflation data and next week’s Fed decision. Markets are pricing about a 60% probability that the Fed raises rates at the Sept. 15-16 meeting, after last week’s strong payrolls report and the latest oil shock kept inflation risk in focus. The Producer Price Index is due Thursday and the Consumer Price Index is due Friday, with traders treating both releases as the final inflation inputs before the meeting. The 10-year Treasury yield rose to about 4.80%, near its highest level since autumn 2023, while the U.S. dollar recovered from earlier weakness. For gold, the setup remains rate-negative: a firm PPI or CPI print would validate the hike trade, while softer inflation would be needed to revive the Waller-led pause case.
Precious metals continue to trade as a rates-and-dollar market rather than a pure safe-haven market. Gold failed again below the $4,422 to $4,465 resistance zone and extended toward the $4,365 support level flagged in the latest technical work. Silver remained compressed below $67.21 and stayed above $64.73 support, leaving the metal trapped inside a tightening triangle. The price action shows that geopolitical demand is still present, but not strong enough to overcome the inflation, oil and yield channel.
The Strait of Hormuz remains the main geopolitical channel into oil, inflation expectations and defensive demand. The latest fighting in the war with Iran pushed Brent crude as high as $99.46 before it settled at $97.92, while reports of attacks on Saudi energy infrastructure and continued shipping risk kept Gulf supply risk elevated. The waterway remains a key pressure point for global energy flows, and Goldman Sachs warned Brent could exceed $120 if the disruption becomes prolonged. For gold, the impact remains conflicted: Hormuz risk supports defensive demand, but higher crude worsens inflation risk, lifts yields and strengthens the case for another Fed hike.
The key outside markets see Nymex WTI crude oil prices firmer and trading in the mid-$90s a barrel, while Brent crude settled near $97.92. The yield on the benchmark 10-year U.S. Treasury note is trading near 4.80%. The U.S. dollar index is firmer. (Kitco Global Index shows how much of today's gold move is the dollar versus the gold market itself.)
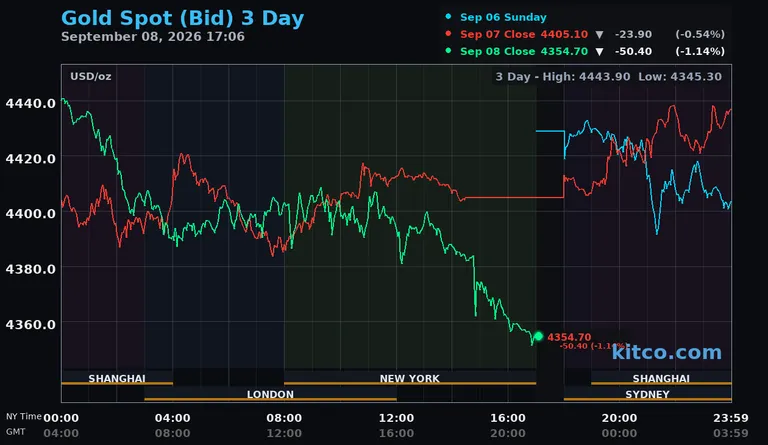
Technically, spot gold bulls' next upside price objective is to push prices back above the $4,422.00 resistance level, with a sustained move targeting $4,465.00 and then $4,564.00. Bears' next near-term downside price objective is a break below $4,365.00, with deeper downside targets at $4,305.00 and then $4,263.00. First resistance is seen at $4,422.00 and then at $4,465.00. First support is seen at $4,365.00 and then at $4,305.00.
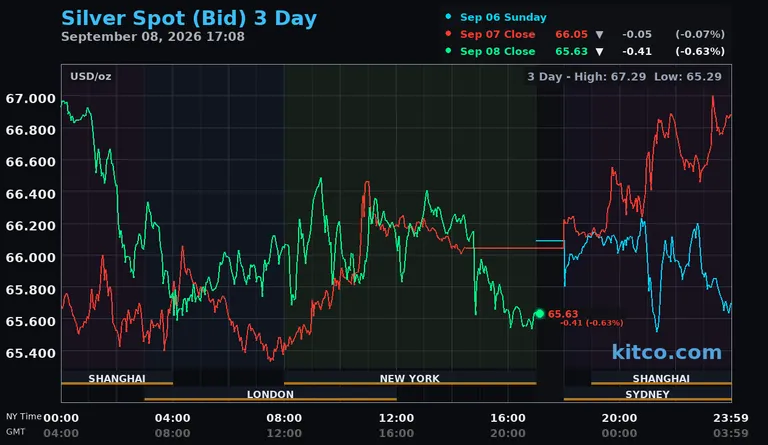
Spot silver bulls' next upside price objective is to drive prices back above $67.21, with a move above that level targeting $68.74 and then $70.76. The next downside price objective for the bears is a break below $64.73, with deeper downside targets at $62.57. First resistance is seen at $67.21 and then at $68.74. Next support is seen at $64.73 and then at $62.57.
See live precious metals prices for gold, silver, platinum and palladium — in USD, CAD and 12 more currencies.

